Over the past decade, orthopedic and musculoskeletal (MSK) services have been immune to many of the negative reimbursement trends experienced by other specialties, as these services have benefited from a large number of elective procedures, strong revenue from ancillary services, and relatively stable reimbursement. Accordingly, many orthopedic practices have been able to maintain sufficient operating margins to remain independent. However, as the Centers for Medicare & Medicaid Services (CMS) focus on alternative payment models and the reduction of hospital utilization, orthopedics has begun to experience declines from historical reimbursement levels.
Reimbursement Trends
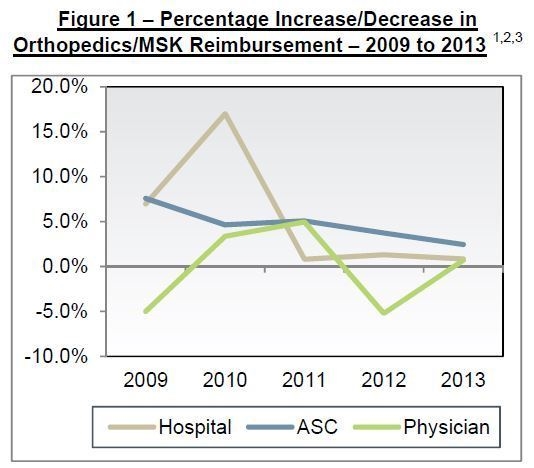
Prior to 2009, orthopedic/MSK services benefited from a stable reimbursement environment characterized by relatively strong year-to-year increases. An analysis of Medicare reimbursement for these services between 2009 and 2013 indicates this may be changing as revenue increases are moderating across various clinical settings, including consults and procedures in physician practices, inpatient surgical cases at hospitals, and outpatient cases at ambulatory surgery centers (ASCs). Because changes in Medicare reimbursement tend to influence commercial payers, the trends evident in Medicare data are likely driving similar changes in commercial plans. Figure 1 outlines the year-to-year increases/decreases in reimbursement in each of the aforementioned sites of service.

The analysis indicates that reimbursement has slowed to low single-digit increases and, in the case of physician services, a significant decrease in 2012, with minimal growth in 2013. This decline is largely attributable to a reduction in reimbursement for procedures, such as arthroscopic surgery and carpal tunnel. As Figure 2 illustrates, reimbursement for evaluation and management (E&M) codes and ancillaries have maintained modest growth, while procedural revenue plummeted.
These reductions in net revenue coincide with continued growth in medical group expenses, as operating costs per physician have increased nearly every year between 2009 and 2012.4 This dynamic is likely encouraging orthopedists toward tighter alignment models (e.g., co-management, employment) with health systems that include some degree of financial support to maintain physician salary
levels.
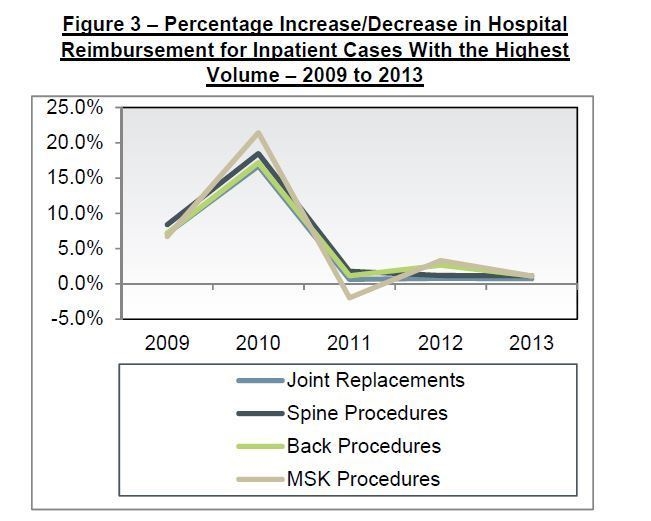
Hospital reimbursement for nearly all MS-DRGs exhibited limited revenue growth. Figure 3 illustrates that reimbursement across all inpatient services is on a similar downward trend.


Finally, the limited growth in ASC reimbursement tends to be concentrated among nerve and muscle procedures and MSK services, which had averaged annual increases of 3.4% until 2013, when reimbursement decreased by 1.5%. Foot and hand procedures in ASCs, as well as fracture/dislocation procedures, exhibited moderating increases from 8% in 2012 to 4% in 2013.
Key Takeaways
The economics of private orthopedic practices and reductions in reimbursement have forced providers to reevaluate the delivery of orthopedic care. As alternative payment models continue to proliferate and a greater emphasis is placed on prevention and the use of lower-cost clinical settings, hospitals and orthopedic groups are pursuing alignment models designed to improve the delivery of orthopedic/MSK care while maintaining favorable operating margins. As a result, many health systems will experience increased consolidation in orthopedic services in the near term as downward pressure on reimbursement continues, costs at private medical groups increase, and alternative payment models expand.
Footnotes
1. Hospital reimbursement is calculated by using the orthopedic/MSK Medicare Severity Diagnosis Related Groups (MS-DRGs) with the greatest volume, as identified by the Medicare Provider Analysis and Review (MEDPAR) Inpatient Hospital National Data Set. The MS-DRG weight and the average base rate for hospitals, as defined by the CMS Acute Inpatient Prospective Payment System (PPS), are used to determine reimbursement.
2. ASC reimbursement is based on all orthopedic/MSK Ambulatory Payment Classifications (APCs) in Addendum A of the CMS Hospital Outpatient PPS.
3. Physician reimbursement is based on professional fees for Medicare reimbursement of the top 25 CPT codes billed by orthopedic surgeons. Medicare reimbursement is based on the work relative value units and conversion factor, as defined by the Medicare Physician Fee Schedule in a given year. The top 25 CPT codes are defined by ECG Management Consultants’ National Provider Compensation, Production, and Benefits Survey, year 2012 based on 2011 data.
4. Operating cost per physician FTE is based on MGMA’s Cost Survey for Single-Specialty Practices: 2008 to 2013 Reports Based on 2007 to 2012 Data, Table 74.4c Operating Cost per Physician FTE, Orthopedic Surgery Practices Not Hospital-/Integrated Delivery System-Owned.

