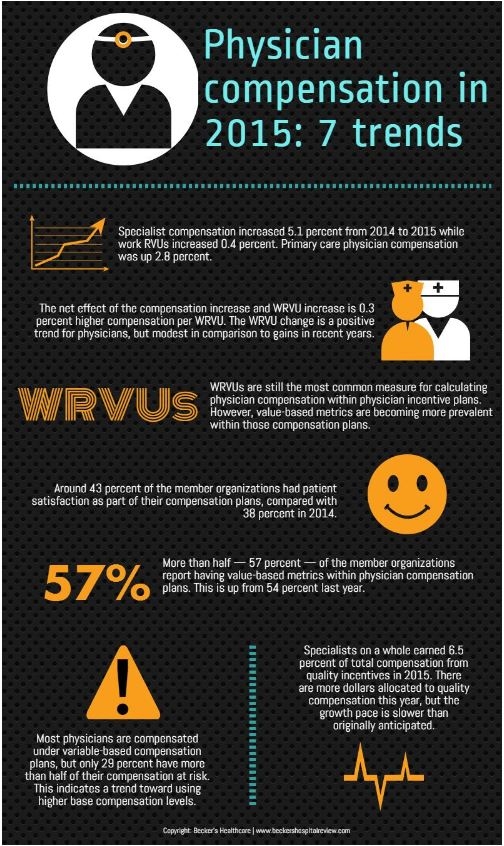
Last month ECG released the results of its 2015 Provider Compensation Survey. Among the key findings, compensation continues to rise for primary care physicians and specialists, but production is inching upwards as well.
Using information from our survey, Becker’s Hospital Review created a stylish infographic that visually conveys seven trends in physician compensation. We’re thrilled that Becker’s saw fit to present our findings in this manner, and we hope you’ll enjoy viewing it. One correction – the infographic states that primary care physician compensation has risen 2.8% from 2014, but in fact it’s up 4.8%.

Click here to learn more.
Survey Methodology
ECG’s Provider Compensation Survey and Pediatric Subspecialty Physician Compensation Survey analyze and report information from more than 34,000 healthcare providers representing more than 134 physician specialties and 15 provider types across the nation. The surveys contain critical provider performance trends such as physician compensation methodologies, compensation and production benchmarks, primary care panel size, CPT procedure code distributions, physician and APC benefit trends, and additional key performance metrics. This information, coupled with ECG’s interpretation of market trends, enables survey members to assess their performance relative to the competitive local market.
ECG’s surveys can be accessed via ECGVault®, a proprietary online benchmarking website made available exclusively to our member organizations.

